:max_bytes(150000):strip_icc():format(jpeg)/GOOGLChart-40135d71734f40c282979611c8f78bd4.gif)
Key Takeaways
- Alphabet shares rose to start the week ahead of the tech giant’s eagerly awaited quarterly report, due after Wednesday’s closing bell.
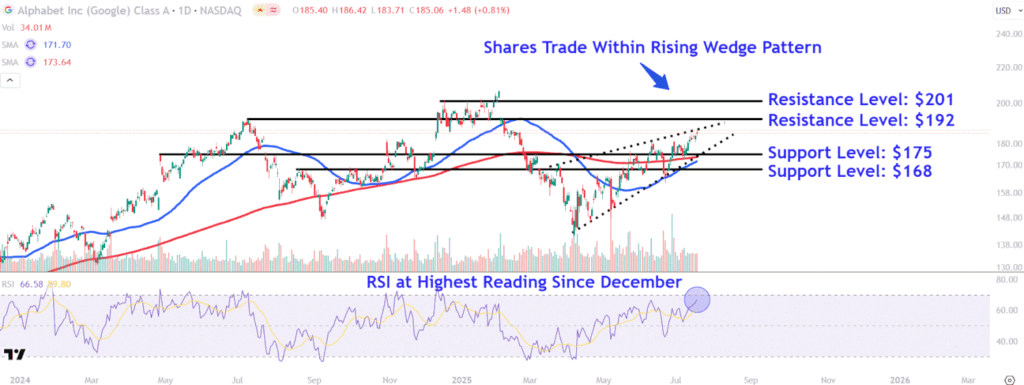
- The stock has rallied toward the upper trendline of a rising wedge pattern leading into the company’s results.
- Investors should watch key support levels on Alphabet’s chart around $175 and $168, while also monitoring major resistance levels near $192 and $201.
Alphabet (GOOGL) shares moved to start the week ahead of the tech giant’s eagerly awaited quarterly report, due after Wednesday’s closing bell.
Investors will be focused on the company’s cloud and advertising revenue growth. Jefferies sees the company’s cloud business benefiting from strong enterprise demand and AI momentum, while analysts at Wedbush recently cautioned that the Magnificent Seven member’s advertising revenue could face challenges from a shift to generative AI search.
Alphabet shares were nearly 3% higher at around $190 in late trading Monday, putting the stock back into positive territory for 2025. The stock has lagged the performance of several of its Big Tech peers amid concerns over the company’s significant AI spending, slower advertising growth, and an expected antitrust decision next month.
Below, we break down the technicals on Alphabet’s chart and identify key price levels to watch out for.
Rising Wedge Takes Shape
Since bottoming out in early April, Alphabet shares have trended higher within a rising wedge, a chart pattern that can signal a move lower upon a decisive breakdown. However, more recently, the price has rallied toward the formation’s upper trendline ahead of the tech giant’s upcoming earning’s report.
The advance has coincided with the relative strength index flashing its highest reading since December, though the indicator remains below overbought levels, providing ample room for the stock to test higher prices.
Let’s point out key support and resistance levels on Alphabet’s chart that investors will likely be watching this week.
Key Support Levels to Watch
The first support level to watch sits around $175. This area may attract buying interest near the rising wedge pattern’s lower trendline and a horizontal line that connects a range of corresponding price action on the chart extending back to last year’s April breakaway gap.
Further downside could see the shares revisit lower support level near $168. Investors may look for entry points in this location around last year’s August and October peaks, which roughly line up with this year’s late March countertrend high.
Major Resistance Levels to Monitor
A breakout from the rising wedge pattern’s upper trendline could initially lead to a test of overhead resistance at $192. The shares may face selling pressure in this location near last year’s prominent July swing high and a series of trading activity on the chart stretching from December to February.
Finally, a close above this level could see Alphabet shares jump to $201. Investors who have accumulated shares at lower prices may seek exit points in this area near three closely aligned peaks that formed on the chart between December and January just below the stock’s all-time high.
The comments, opinions, and analyses expressed on Investopedia are for informational purposes only. Read our warranty and liability disclaimer for more info.
As of the date this article was written, the author does not own any of the above securities.


