:max_bytes(150000):strip_icc():format(jpeg)/HOODChart-f27fcea1bdea444b8554abe98e5ec439.gif)
Key Takeaways
- Robinhood shares jumped Monday following news that the retail trading platform will be added to the benchmark S&P 500 index.
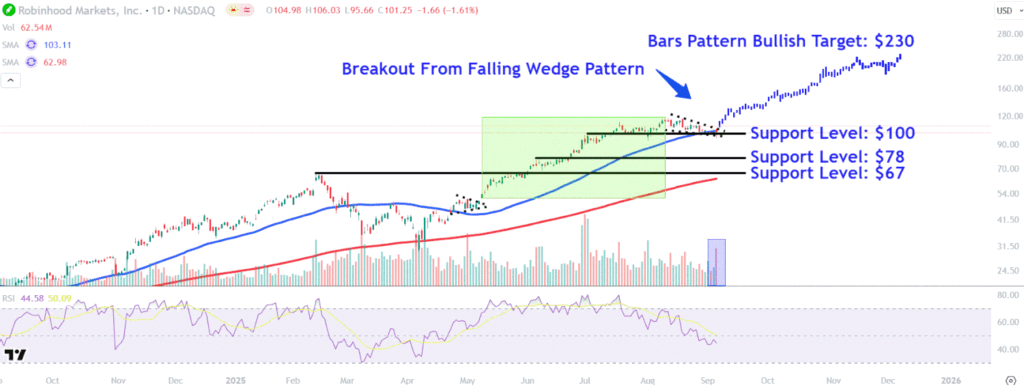
- The price broke out above a falling wedge pattern on Monday, indicating a continuation of the stock’s longer-term uptrend.
- Bars pattern analysis predicts a potential bullish price target of around $230 and indicates a new move higher could last until December this year.
- During pullbacks in the stock, investors should watch important support levels on Robinhood’s chart near $100, $78 and $67.
Robinhood Markets (HOOD) shares soared Monday on news that the retail trading platform known for commission-free stock trading will be added to the benchmark S&P 500 index.
Late Friday, S&P Global said Robinhood, along with mobile app monetization company AppLovin (APP) and navigation systems maker Emcor Group (EME), would join the large cap index, with the inclusions taking effect before the beginning of trading on Sept. 22. Stocks that join the S&P 500 typically receive a boost from fund managers who buy them to add to index tracking exchange-traded funds (ETFs).
Robinhood shares jumped 16% on Monday to $117.28, a record closing high. The stock has more than tripled since the start of the year, lifted by a resurgence of retail trading activity in meme stocks, crypto, options and mega-cap tech stocks.
Below, we take a closer look at the technicals on Robinhood’s chart and point out important price levels that investors will likely be watching.
Falling Wedge Breakout
After hitting their all-time high last month, Robinhood shares had consolidated within a falling wedge, indicating a continuation of the stock’s broader uptrend.
Indeed, the price broke out from the pattern’s upper trendline on Monday. Interestingly, the stock registered its highest trading volume on Friday in over a month, suggesting ETF repositioning on anticipation of the announcement.
Let’s use technical analysis to predict how a move higher in the stock may unfold and also identify important support levels worth watching during future pullbacks in the stock.
Where Are Robinhood Shares Headed Next?
To forecast where Robinhood’s share price may be headed next, investors can use bars pattern analysis, a technique that analyzes prior trends to make future price projections.
This forecasts a potential bullish target of around $230 and that a new move higher could last until December this year if a similar move replicates over the coming months. Interestingly, the earlier trend followed a breakout from a prior consolidation pattern on the chart, providing clues as to how a breakout from the current falling wedge could unfold.
Support Levels Worth Watching
During pullbacks in the stock, it’s initially worth keeping tabs on the psychological $100 level. This area could provide support near the falling wedge pattern’s lower trendline and a series of corresponding trading activity on the chart stretching back to early July.
The bulls’ failure to successfully defend this level could see the shares retreat to support around $78. Investors may look for buying opportunities in this location near the top of a consolidation period that formed on the chart throughout most of June.
Finally, a deeper retracement in Robinhood shares may lead to a test of lower support at $67. Investors could seek buy-and-hold entries in this region near the prominent February peak, which closely aligns with a brief pause in the stock’s uptrend during late May.
The comments, opinions, and analyses expressed on Investopedia are for informational purposes only. Read our warranty and liability disclaimer for more info.
As of the date this article was written, the author does not own any of the above securities.


