:max_bytes(150000):strip_icc():format(jpeg)/AMZNChart-3ab30b45763f4bdf91dd3cac1dd36128.gif)
Key Takeaways
- Amazon shares are in focus to start the week after plunging Friday as quarterly results from the e-commerce and cloud provider failed to impress investors.
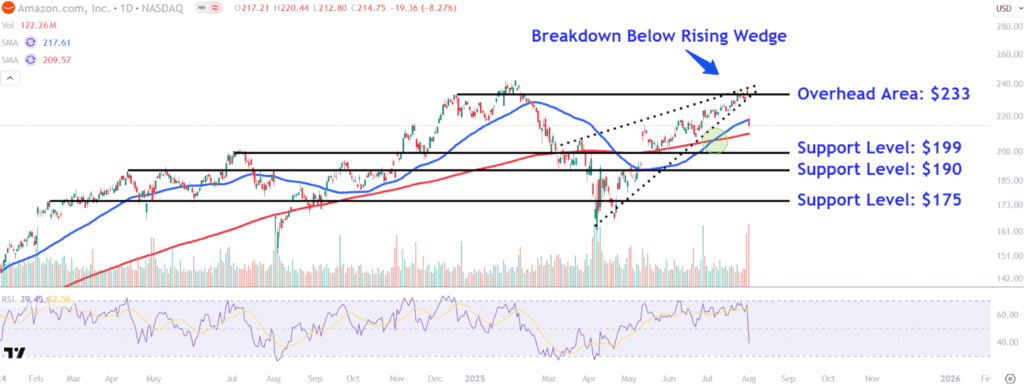
- The stock price fell below the lower trendline of a rising wedge pattern on Friday, potentially laying the groundwork for further earnings-related selling.
- Investors should watch key support levels on Amazon’s chart around $199, $190 and $175, while also monitoring a major overhead area near $233.
Amazon (AMZN) shares are in focus to start the week after plunging Friday as quarterly results from the e-commerce and cloud provider failed to impress investors.
While the company posted growth in its Amazon Web Services business, investors may have expected more after rivals Microsoft (MSFT) and Google parent Alphabet (GOOGL) recently reported strong results in their cloud units. The company’s AWS revenue grew 17.5% in its latest quarter, well below Microsoft’s Azure growth of 39% and trailing the 32% sales increase in Google Cloud Platform. Following the results, analysts at Jefferies said that AWS growth was “disappointing given big momentum at Azure and GPC.”
Amazon shares fell 8% to just close Friday’s session at just below $215, pushing the stock into negative territory for the year. Some analysts raised their price targets on Amazon following the earnings report, with those at JPMorgan analysts saying they “would buy the pullback.”
Below, we take a closer look at Amazon’s chart and apply technical analysis to point out key post-earnings price levels that investors will likely be watching.
Rising Wedge Breakdown
Since setting their early-April low, Amazon shares had trended higher within a rising wedge, a move that coincided with the 50-day moving average (MA) recently crossing above the 200-day MA to form a bullish golden cross.
However, the stock’s upward momentum ended abruptly Friday, with the price closing below the rising wedge pattern’s lower trendline, potentially laying the groundwork for further selling.
Let’s identify key support levels on Amazon’s chart to watch and also point out a major overhead area worth monitoring during potential recovery efforts.
Key Support Levels to Watch
The first support level to watch sits around $199. The shares may find support in this location near last July’s peak, which also closely aligns with troughs that formed on the chart in November and May.
A decisive close below this level could see the stock revisit support at $190. Investors may look to accumulate shares in this region around a multi-month horizontal line that connects a range of corresponding price action on the chart extending back to April last year.
A deeper retracement opens the door for the shares revisiting lower support at the $175 level. This area could attract buying interest near a series of trading activity on the chart stretching from February last year to April this year.
Major Overhead Area Worth Monitoring
During potential recovery efforts in Amazon’s stock, it’s worth monitoring how the price responds to the $233 level. This area on the chart could provide selling pressure near the rising wedge pattern’s peak and the December swing high.
The comments, opinions, and analyses expressed on Investopedia are for informational purposes only. Read our warranty and liability disclaimer for more info.
As of the date this article was written, the author does not own any of the above securities.


