:max_bytes(150000):strip_icc():format(jpeg)/MDBChart-976b3bc3283d4dceadf93a06fc269038.jpg)
Key Takeaways
- MongoDB shares soared Wednesday after the database software provider lifted its outlook and topped Wall Street’s quarterly sales expectations.
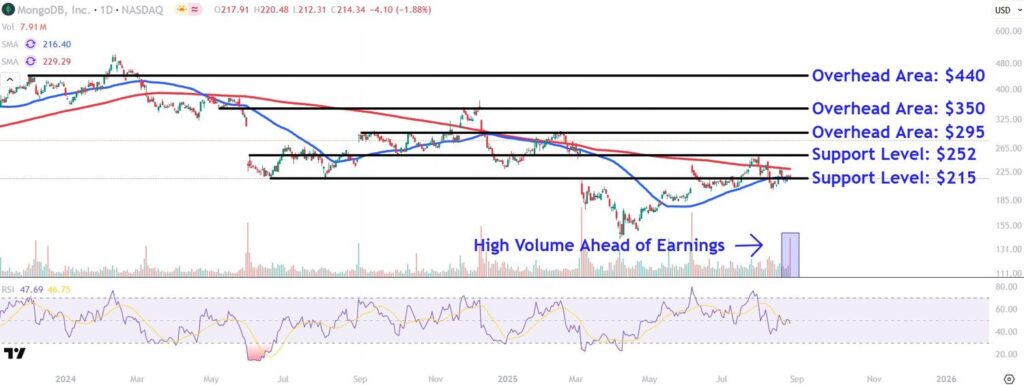
- The stock has consolidated near the key 50- and 200-day moving averages in recent weeks, potentially signaling accumulation by larger market participants ahead of the company’s quarterly report.
- Investors should watch crucial overhead areas on MongoDB’s chart around $295, $350, and $440, while also monitoring major support levels near $252 and $215.
MongoDB (MDB) shares soared over 30% Wednesday morning after the database software provider lifted its full-year outlook and topped Wall Street’s quarterly sales expectations.
The company said revenue from its flagship Atlas platform jumped 29% year-over-year in the second quarter, while subscription revenue climbed 23%. The software provider also said it added a record 5,000 customers in the first half of the year, boosted by growing demand from users building artificial intelligence applications.
Heading into the company’s report, MongoDB shares were down about 8% for the year amid some concerns about increasing competition and slowing enterprise spending, with Wednesday’s gains bringing the stock back into positive territory for 2025.
Below, we break down the technicals on MongoDB’s chart and identify key price levels worth watching out for.
Earnings-Driven Breakout After Accumulation
MongoDB shares have consolidated near the key 50- and 200-day moving averages in recent weeks, potentially signaling accumulation by larger market participants ahead of the company’s quarterly results.
The stock also registered its highest trading volume since early June, indicating some investors positioned for post-earnings volatility.
Let’s identify three crucial overhead areas to watch on MongoDB’s chart if the shares extend their post-earnings rally and also point out major support levels worth monitoring during potential retracements.
Crucial Overhead Areas to Watch
The first overhead area to track sits around $295. This location could provide overhead selling pressure near several prominent peaks that formed on the chart between September last year and February this year.
Further buying in the stock could fuel a move toward $350. The shares may face resistance at this level near last year’s early May trough, which closely aligns with several peaks that emerged on the chart in November and December.
A successful close above this level could spark a more bullish rally to the $440 area. Investors who have bought the shares at lower prices may decide to place sell orders in this region near the November 2023 swing high.
Major Support Levels Worth Monitoring
During a retracement in the stock, investors should initially monitor the $252 level. The shares could attract buying interest in this area near a horizontal line that stretches back to the early June 2024 high following a sharp gap lower.
Selling below this level could see the stock retest major support around $215. Investors may seek to accumulate MongoDB shares in this region near two notable swing lows that formed on the chart in June and August last year.
The comments, opinions, and analyses expressed on Investopedia are for informational purposes only. Read our warranty and liability disclaimer for more info.
As of the date this article was written, the author does not own any of the above securities.


