:max_bytes(150000):strip_icc():format(jpeg)/NBISChart-2ccb6a9c726e45bba624ba0cd3663193.gif)
Key Takeaways
- Nebius shares jumped to a record high Tuesday morning after the Amsterdam-based AI infrastructure provider said it has inked an agreement with Microsoft worth up to $19.4 billion over five years.
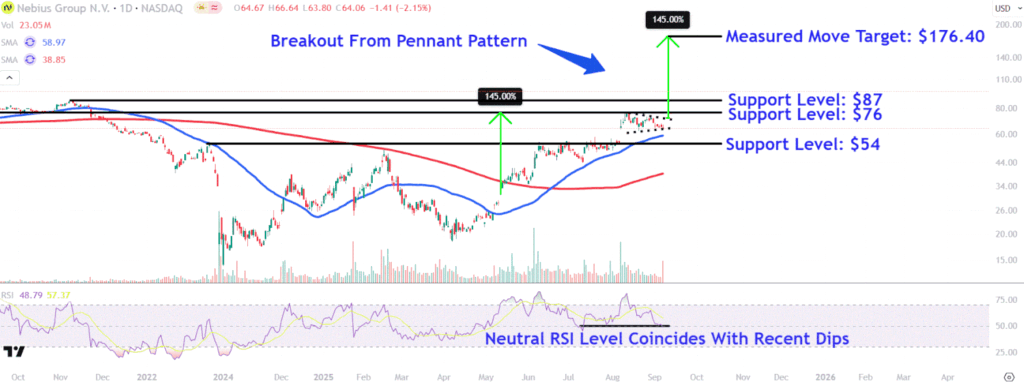
- The price broke out from a pennant, a chart pattern that signals a continuation of the stock’s uptrend.
- The measured move technique forecasts a bullish price target of $176.40. Investors should watch major support levels on the Nebius chart around $87, $76 and $54.
Nebius Group shares jumped Tuesday after the Amsterdam-based AI infrastructure provider said it has inked an agreement with Microsoft worth up to $19.4 billion over five years.
Under the deal, Nebius (NBIS) will deliver computing resources to Microsoft (MSFT) later this year using a data center in New Jersey, helping the Azure owner address a demand shortage for cloud infrastructure that can process increasing AI workloads. CEO Arkady Volozh said it’s the first time Nebius had signed a long-term contract with a large tech company, and added that there are likely more to come.
Nebius stock was up 37% at $88 in recent trading after hitting an all-time high near $98 in the opening minutes of the session. The stock has more than tripled since the start of 2025, boosted in part by news AI favorite Nvidia (NVDA) had taken a stake in the company.
Below we analyze the technicals on the Nebius chart and identify major price levels worth watching out for after the stock’s big move today.
Pennant Pattern Breakout
After climbing to their highest level in more than three years last month, Nebius shares had consolidated in a pennant, a chart pattern that signals a bullish continuation upon a breakout to the upside.
That move higher took place on Tuesday, setting the stage for potential follow-through buying. Interestingly, prior to today’s surge, the relative strength index bottomed around its neutral reading, the same level that coincided with the end of a dip in early July.
Let’s use technical analysis to forecast a potential bullish price target to monitor and also point out major support levels worth watching during potential retracements.
Bullish Price Target to Monitor
Investors can forecast a bullish price target by using the measured move technique, a study that analyzes chart patterns to project future price movements.
When applying the analysis to the Nebius chart, we measure the percentage change of the steep uptrend from May to August that preceded the pennant and add it to the pattern’s top trendline value, assuming a similar continuation move may play out in the months ahead.
For example, we apply a 145% increase to $72, which projects a target of $176.40—implying that the stock could more than double from Monday’s closing price.
Major Support Levels Worth Watching
During retracements, investors should initially watch the $87 level. The stock could be snapped up at this level by investors looking for entry points on a retest of the prominent November 2021 peak, which also marks the stock’s prior all-time high.
A close below this level could see the shares fall to support near $76. This area may provide support around the top of the pennant, which also corresponds with a period of trading activity on the chart between September and October 2021.
Finally, a more-significant drop in Nebius shares could bring lower support at $54 into play. Investors may seek buying opportunities at this location near the February 2022 countertrend peak and a range of sideways price action on the chart that preceded a notable stock gap last month.
The comments, opinions, and analyses expressed on Investopedia are for informational purposes only. Read our warranty and liability disclaimer for more info.
As of the date this article was written, the author does not own any of the above securities.


