


Understanding how to read a gold futures streaming chart is an essential skill for anyone looking to navigate the precious metals market with confidence. Gold has long been considered a premier safe haven asset, attracting investors during times of economic uncertainty and inflation. By monitoring real time price movements, traders and long term savers alike can gain valuable insights into market sentiment and global economic health.
A streaming chart provides continuous, second by second updates on the price of gold contracts. These contracts represent an agreement to buy or sell the precious metal at a set price on a specified future date. Because the market operates nearly twenty four hours a day, keeping a close eye on these live fluctuations helps investors spot emerging trends and potential entry or exit points.
Key Components of a Gold Futures Streaming Chart
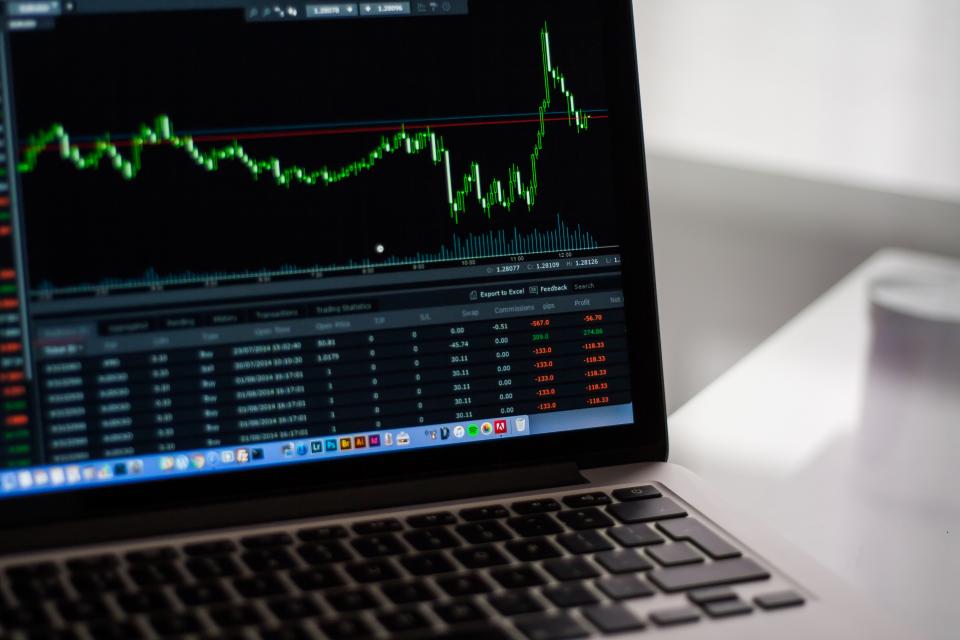
When you first look at a gold futures streaming chart, you will notice several key indicators that reveal the strength of the market. The most prominent feature is the price line or candlestick pattern, which illustrates the price movement over selected timeframes, ranging from one minute to one month. Candlestick charts are particularly useful because they show the opening, closing, high, and low prices for each specific period.
Another vital element to observe is trading volume, which indicates the number of contracts bought and sold over a given timeframe. High volume accompanying a price increase suggests strong buying pressure, while low volume might indicate a lack of momentum. Additionally, open interest, which measures the total number of outstanding active contracts, helps traders gauge the depth and liquidity of the market.
Using Real Time Data for Portfolio Decisions
Incorporating a gold futures streaming chart into your regular financial routine allows for more disciplined decision making. Investors often use technical analysis tools, such as moving averages and relative strength indicators, directly on these streaming platforms to identify support and resistance levels. These technical markers help predict where price declines might halt or where upward trends might face selling pressure.
While these charts offer powerful insights, it is important to remember that short term volatility is common in commodities trading. Please note that this article is intended for general informational purposes only and does not constitute professional financial advice. Investors should always conduct thorough research and consider their personal risk tolerance before committing capital to the market.
Ultimately, mastering the use of live financial charts empowers you to look beyond daily headlines and base your wealth strategy on objective market data. By tracking live trends, understanding volume indicators, and observing global market reactions, you can build a more resilient investment portfolio over the long term.
Image: Openverse (public domain)
